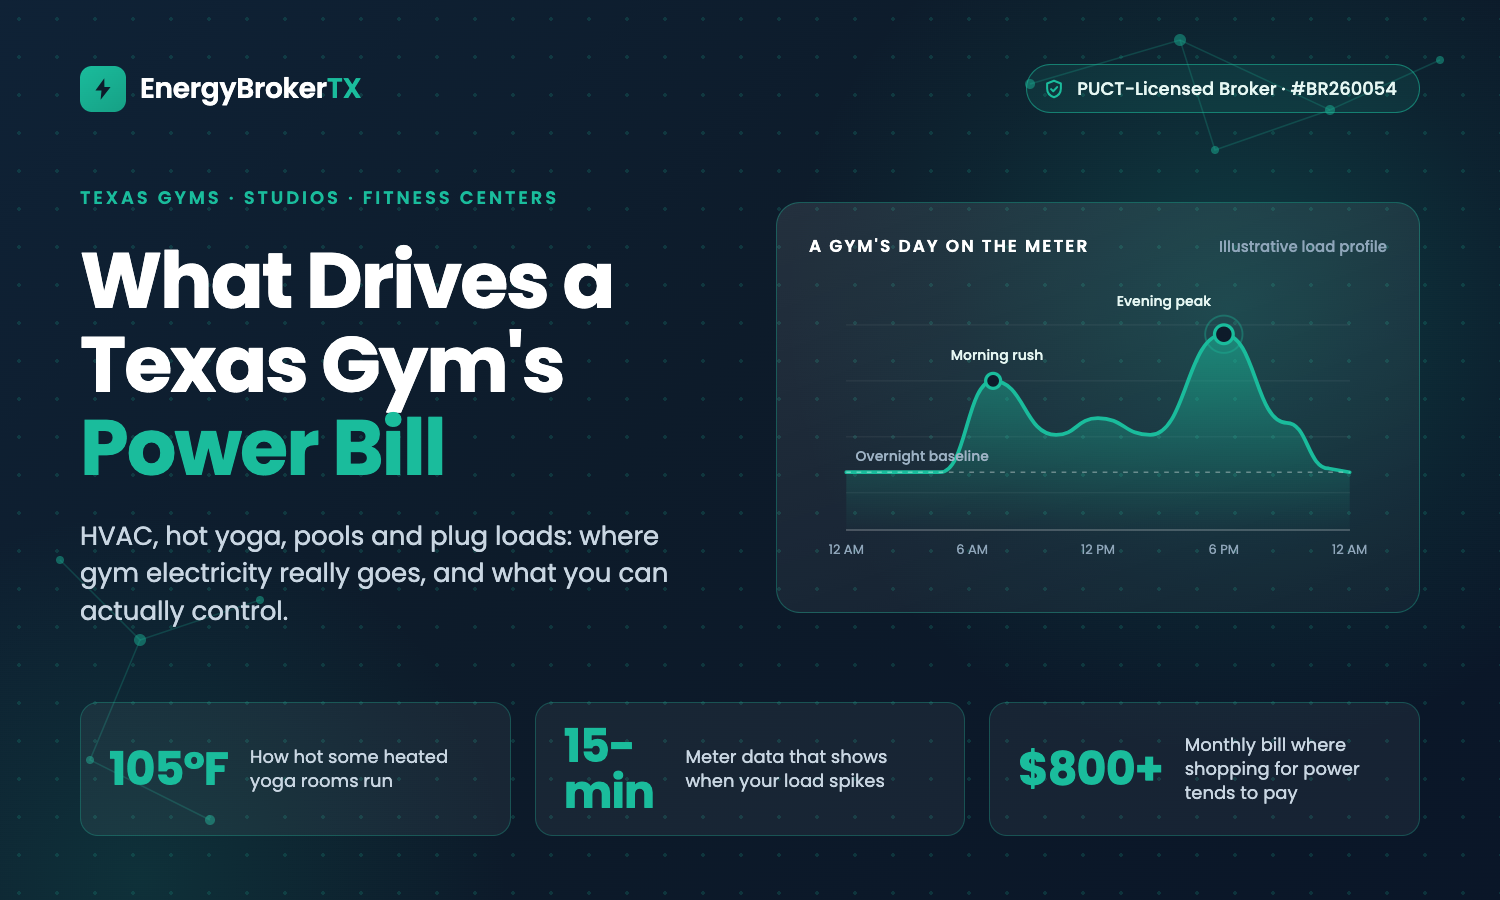
Texas Gyms, Yoga Studios and Fitness Centers: What Drives the Power Bill
What drives the power bill at Texas gyms, yoga studios and fitness centers, from HVAC and hot yoga to pools, and when shopping your rate pays off.

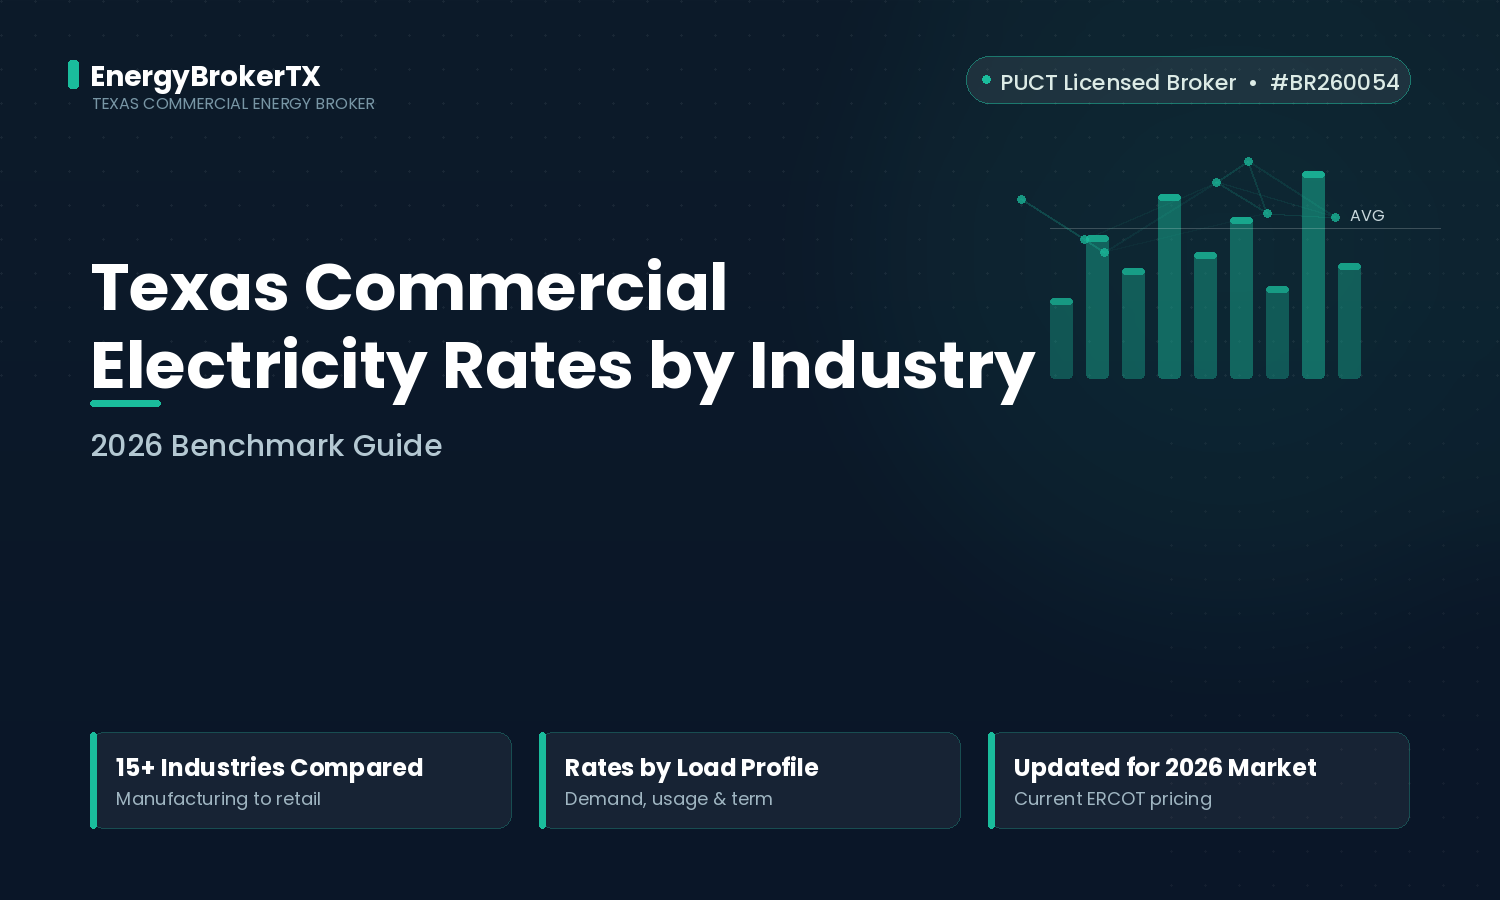
"What's a good electricity rate for my business?" doesn't have one answer in Texas — it depends heavily on your industry's load profile. A restaurant's electricity cost structure looks nothing like a data center's, and a church's looks nothing like a warehouse's, even at identical monthly kWh totals. Demand charge exposure, time-of-use patterns, and seasonality all vary by industry independent of overall usage volume, and those differences show up directly in what a competitively bid rate should look like for your specific type of operation.
This guide is a single reference point: what competitively bid supply rates typically look like across the industries we work with most, and links to a full deep-dive for each. The ranges below come from actual reverse auction results across the accounts we've worked with in each vertical — not published rate cards, which reflect list pricing rather than what a genuine multi-provider competitive process actually produces.
Two notes before the numbers. First, every range below is the supply rate — the negotiable, REP-set portion of your bill — not your all-in cost, which also includes fixed TDSP delivery charges that don't vary by industry, only by territory. Second, these are competitively bid ranges. If you're currently paying above the top of your industry's range, you're very likely on a passive renewal or holdover rate, not a market rate — see our guide on what happens when a contract isn't renewed for why that gap opens up.
Restaurants and bars: 7.8–9.0¢/kWh. High kitchen equipment and HVAC loads concentrated in service windows drive significant demand charge exposure relative to total usage.
Hotels: Similar range to restaurants, with the added complexity of 24/7 occupancy and pool/laundry loads that keep baseline consumption high even during low-occupancy periods.
Retail stores and convenience stores: 7.5–8.8¢/kWh, driven mainly by lighting, signage, and refrigeration running continuously regardless of foot traffic.
Grocery and supermarket accounts run at the higher end of retail, since refrigeration and freezer cases create some of the least flexible, highest-demand-charge load profiles in commercial retail.
Manufacturing and industrial: 7.0–8.2¢/kWh — the widest demand-charge exposure of any vertical, since production equipment can represent 40–50% of total cost for high-intensity operations. See our dedicated breakdown of how manufacturing demand charges are calculated.
Warehouses and distribution centers: Similar range, with cold storage facilities pushing toward the higher end due to continuous refrigeration load layered on top of conveyor and dock equipment.
Auto dealerships: Showroom lighting, service bay equipment, and lot lighting create a distinct profile from either retail or industrial — worth a dedicated competitive bid rather than assuming either benchmark applies.
Data centers and Bitcoin mining operate in a different pricing tier entirely given the scale and constancy of the load — see our dedicated guide on siting and procurement for large-load facilities.
EV charging stations carry a load profile driven almost entirely by demand charges rather than total consumption, since charging sessions concentrate draw into short, intense windows.
Dental practices and small medical offices: 7.8–9.5¢/kWh, with demand charges frequently running 25–35% of the total bill due to sterilization and imaging equipment.
Hospitals and larger medical facilities carry the added complexity of critical-load reliability requirements alongside standard procurement.
Schools and universities and municipalities typically qualify for competitive rates in the 7.2–8.4¢/kWh range, with the added advantage of public-budget predictability making longer fixed terms attractive.
Office buildings and professional services: 7.2–8.4¢/kWh, the most stable and predictable weekday-driven load profile of any vertical, which is exactly why it benefits from longer fixed terms.
Multifamily and apartment common-area accounts and assisted living facilities both benefit heavily from portfolio aggregation — bidding multiple properties or buildings as a single load rather than one at a time.
Churches run 7.8–8.8¢/kWh with a weekend-peak, weekday-low load profile distinct from every other vertical on this list — and many qualify for a sales tax exemption on electricity that has nothing to do with the supply rate itself. The same applies to many 501(c)(3) nonprofits more broadly.
These ranges assume a competitively bid, 12–36 month fixed contract signed within the past year. Three things routinely push a business outside its industry range: a contract that's rolled onto a holdover rate after expiration, a rate locked during a seasonal price spike rather than the spring or fall shoulder season, and simply never having run a competitive bid at all. None of those are industry-specific — they apply the same way whether you run a restaurant or a warehouse.
If your current rate sits meaningfully above your industry's range, the fastest way to find out why is to run the numbers through an actual competitive reverse auction rather than guessing from a benchmark. Contact EnergyBrokerTX for a free rate comparison specific to your industry and account size — no cost, no obligation, results within 24 hours. PUC License #BR260054.
Submit your account and we'll run a competitive auction with 25+ licensed Texas providers — full bid transparency, no pre-filtering, no obligation.
Get My Free Competing Bids →